Gartner Magic Quadrant for Analytics & BI - 2022
Gartner's 2022 ‘Magic Quadrant’ for BI & Analytics has been released. Microsoft and Tableau continue to be recognised as Leaders.
Montage are New Zealand’s only company with partnerships with both Microsoft and Tableau and are proud to partner with both these market leaders. Montage are a Microsoft Gold Data & Analytics partner, and are New Zealand's leading Tableau Partner.
Montage supports Microsoft (including Power BI) and Tableau clients with product selection, license purchases, report and dashboard development, and user training and mentoring. For help in assessing which might be best for your organisation, get in contact with us and we’ll be happy to help.
The 2022 Magic Quadrant for Analytics & BI is:

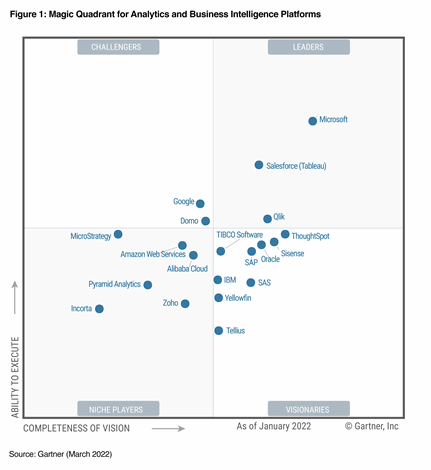
(Source: Gartner, Feb 2022. Read the full report here)
Some interesting quotes from the 2022 Gartner report include:
- “Today’s ABI platforms have an emphasis on visual self-service for end users, augmented by AI to deliver automated insights. Increasingly, the focus of augmentation is shifting from the analyst persona to the consumer or decision maker."
- "Many platforms are adding capabilities for users to easily compose low-code or no-code automation workflows and applications. This blend of capabilities is helping to expand the vision for analytics beyond simply delivering datasets and presenting dashboards to delivering enriched contextualized insights, refocusing attention on decision-making processes, and ultimately taking actions that will deliver business value."
Microsoft strengths (includes Power BI and Azure):
-
Alignment with Office 365, Teams and Azure Synapse: The inclusion of Power BI in the Office 365 E5 SKU has provided an enormous channel for the platform’s spread. As many customers turn to Teams for remote work collaboration, the ability to access Power BI and now “goals” within the same Teams interface is a compelling integration for business users. Power BI and Azure Synapse alignment addresses multiple data and analytics personas and use cases.
-
Price/value combination: Power BI does not sacrifice quality in order to achieve its disruptively low pricing model. The Power BI cloud service is rich in its capabilities, which include an enlarged set of augmented analytics and automated ML (autoML) capabilities.
-
Power portfolio and product ambition: Microsoft has a clear vision for cross-utilization of Power BI, Power Apps and Power Automate to drive business value. Power Apps can be embedded in Power BI dashboards or access Power BI datasets, and Power Automate flows can be constructed to take various actions based on the data. AI-powered services, such as text, sentiment and image analytics, are available within Power BI Premium.
Tableau strengths:
-
Business user-centric: Tableau provides an intuitive experience for business users to visually explore their data. The patented VizQL engine powers the no-code drag-and-drop interface. The acquisition of Narrative Science, the data storytelling vendor, will improve Tableau’s NLG and data storytelling capabilities in the future.
-
Analytics economy: Users demonstrate a fanlike attitude toward Tableau. The analytics ecosystem Tableau has built, the Tableau Economy, brings an expansive community of customers, partners and people with analytics skills. One hundred new accelerators were rolled out in the Tableau Exchange, and a “Hire Me” function was added to Tableau Public to help hire talent with Tableau skills.
-
Salesforce ecosystem opportunity: A new revenue category, “Data,” will incorporate MuleSoft, Tableau and Tableau CRM, all of which were previously included in “Platform and Other,” demonstrating Salesforce’s dedicated investment to data and analytics business as part of its ecosystem.
In 2019, Gartner identified the below business benefits achieved by investing in BI & Analytics:
- Increased revenue
- Better, faster decisions
- Improved customer satisfaction
- Reduced IT head count
- Reduced external IT costs
- Reduced non-IT costs
- Expansion of types of analysis
- Availability of better insights to more people
- Linking of KPIs to corporate objectives
- Monetisation of data