Tableau is being used by various government agencies and affiliates to share insights with the New Zealand public.
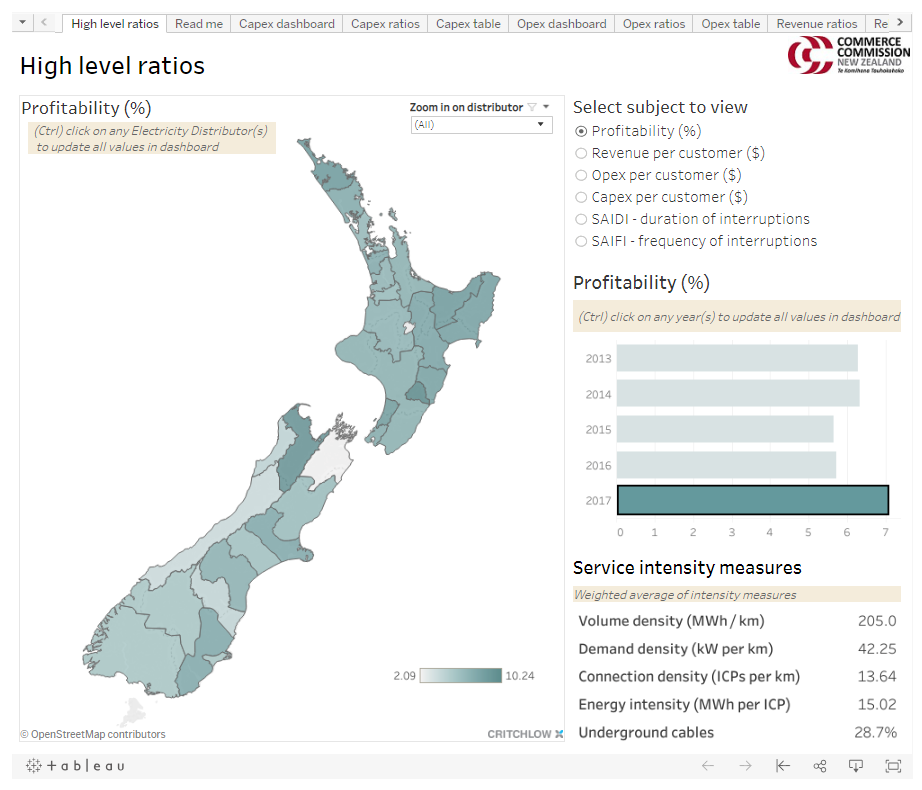
Commerce Commission
The Commerce Commission publishes PAT, a Performance Accessibility Tool for electricity distributors via Tableau. This includes data and analysis on each electricity distributors' profitability and revenue, capital and operating expenditure, and reliability data.
The Performance Accessibility Tool uses data that the Commerce Commission collects from the 29 electricity distribution businesses that they regulate in accordance with information disclosure requirements.
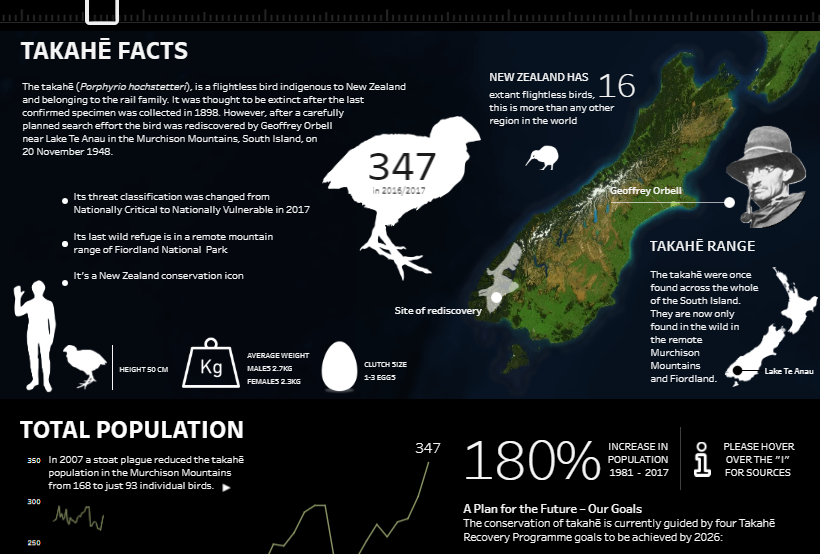
The Takahē Recovery Programme involves DOC’s dedicated Takahē Team and iwi working with a network of people around New Zealand, to ensure the takahē is never again considered extinct.
On their website, DoC feature Jonni Walker's visual analysis of DoC's Takahe conservation efforts.
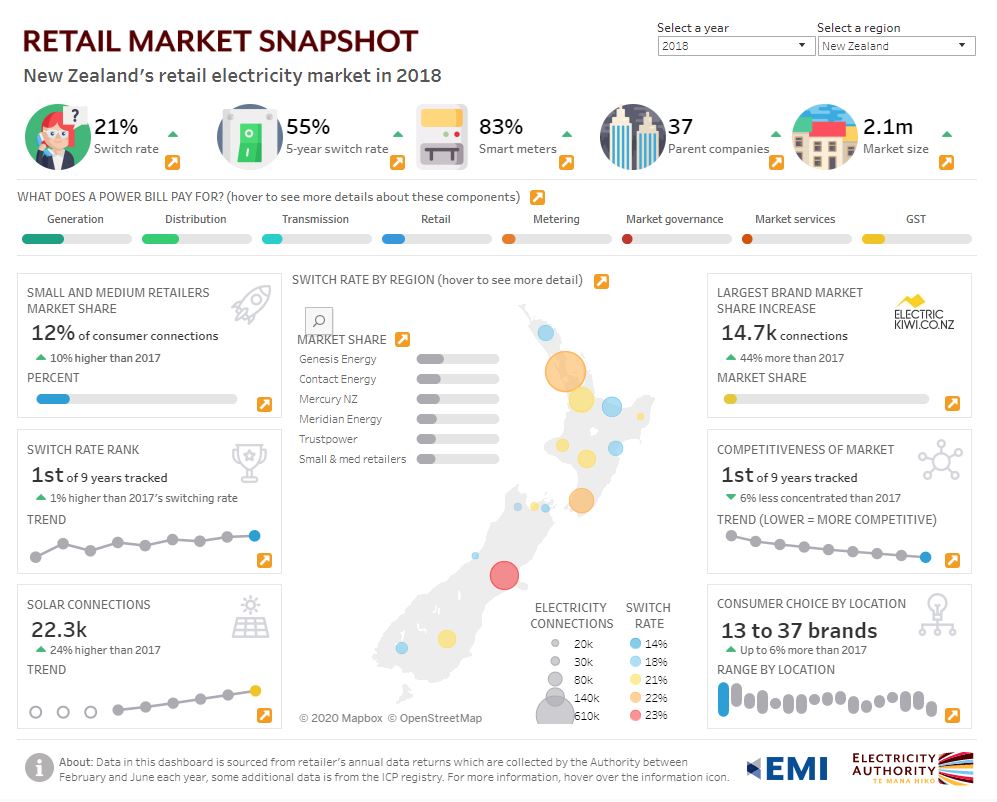
The Electricity Authority publish this Retail Market Snapshot, which highlights key changes in the New Zealand retail electricity market over time. This snapshot is a summary of selected retail electricity market performance indicators since 2010.
Users are encouraged to engage and interact with the information to see how the electricity market has evolved since 2010.
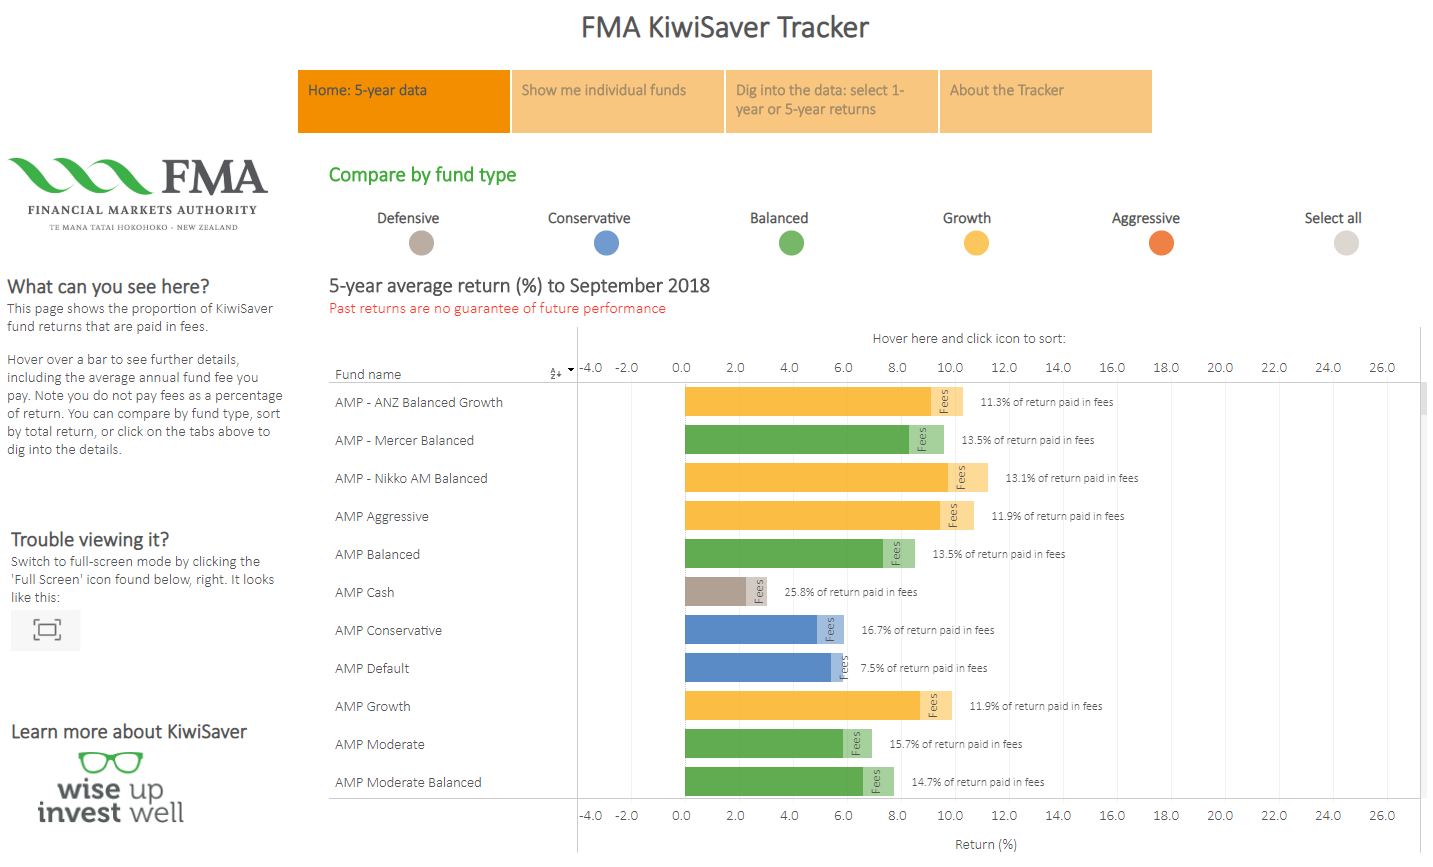
Financial Markets Authority (FMA)
The FMA publishes KiwiSaver data in an interactive format to prompt discussion, engagement and debate on the relationship between investment risk, returns and fees.
The FMA KiwiSaver Tracker shows a) the risk profile, returns and fees for each fund, b) a % figure for how much of the return is paid to the fund manager in fees (excluding fixed management fees) and how much is paid to investors and c) data that currently covers the past year and average five-year returns.
Health Quality & Safety Commission
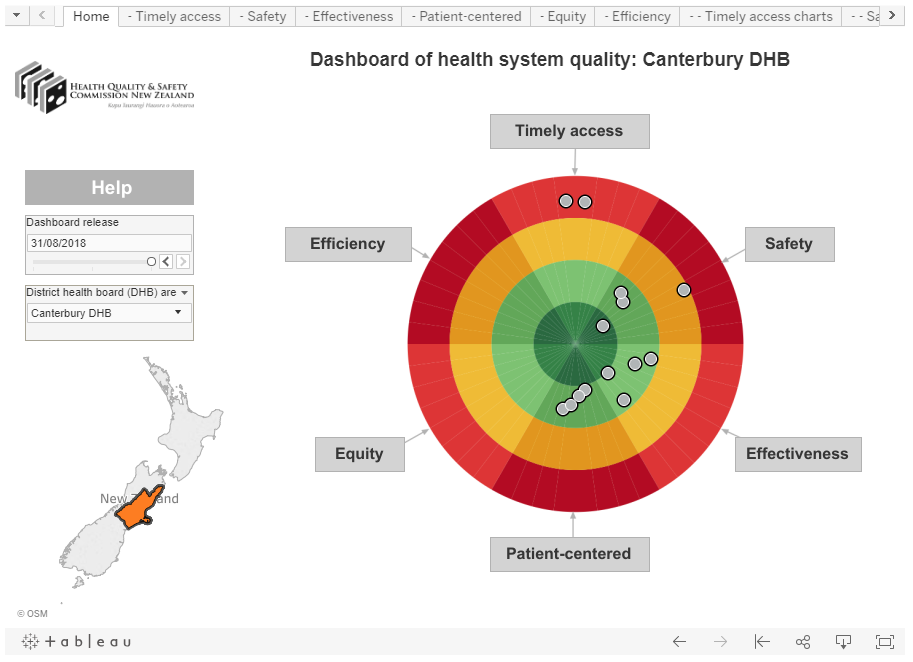
The HQSC publishes a publicly-availabledashboard of health system qualitythat shows how NZ district health boards (DHBs) are performing in a variety of areas. The dashboard takes information from a range of sources and puts it together in one place.
A simple-to-read, interactive chart make it easy for users to ‘drill down’ into the data without having to look through different areas on the HQSC website, and for providers and consumers to access the various information that HQSC publishes about DHBs at a glance, including how this changes over time.
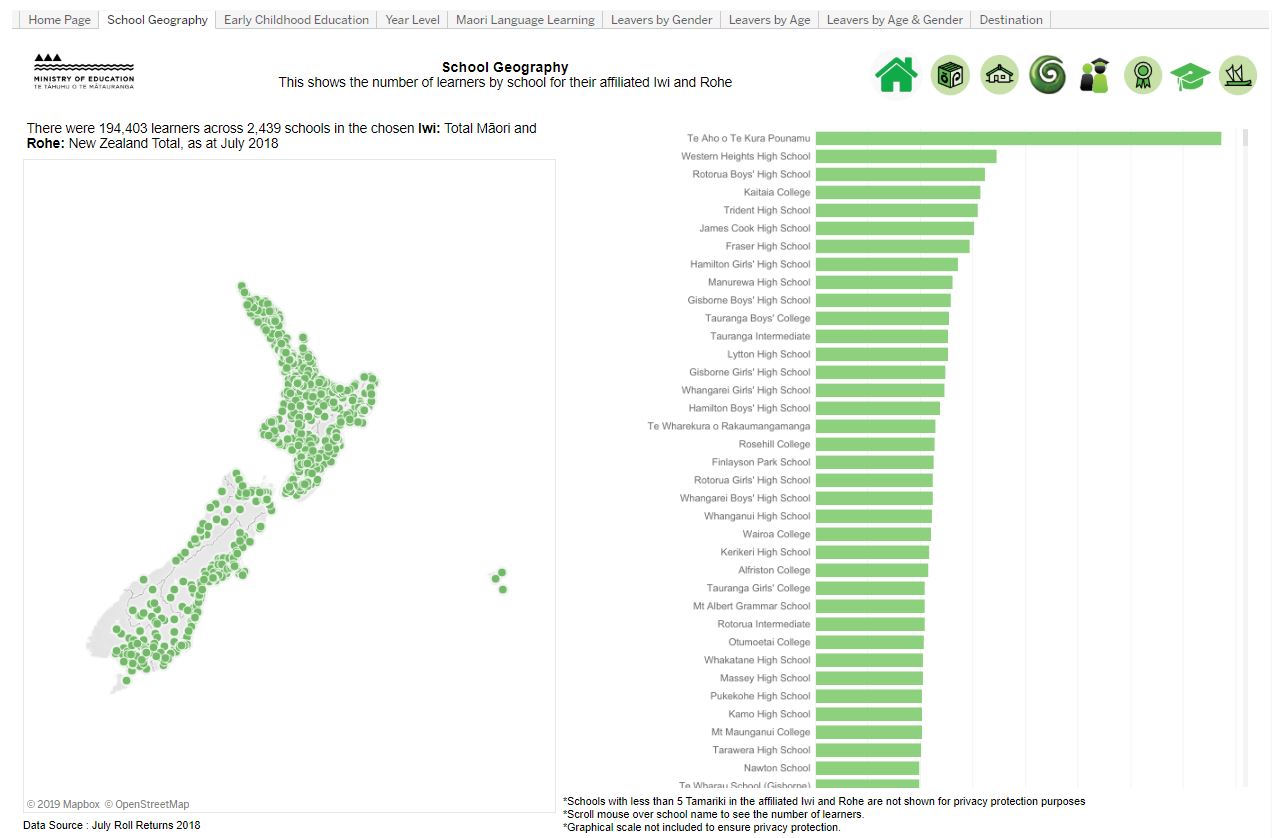
Since 2013, the Ministry of Education has prepared student achievement profiles for around 65 iwi and Māori education groups. In 2018 the decision was made to retire the current Iwi Profiles (A3 Posters) and offer instead a new interactive Dashboard.
Te Mataaho-ā-Iwi, the Iwi profiles Dashboard project, is the result. A product that provides data about Māori learners and learners who have identified with individual iwi, and can provide a national or rohe view.
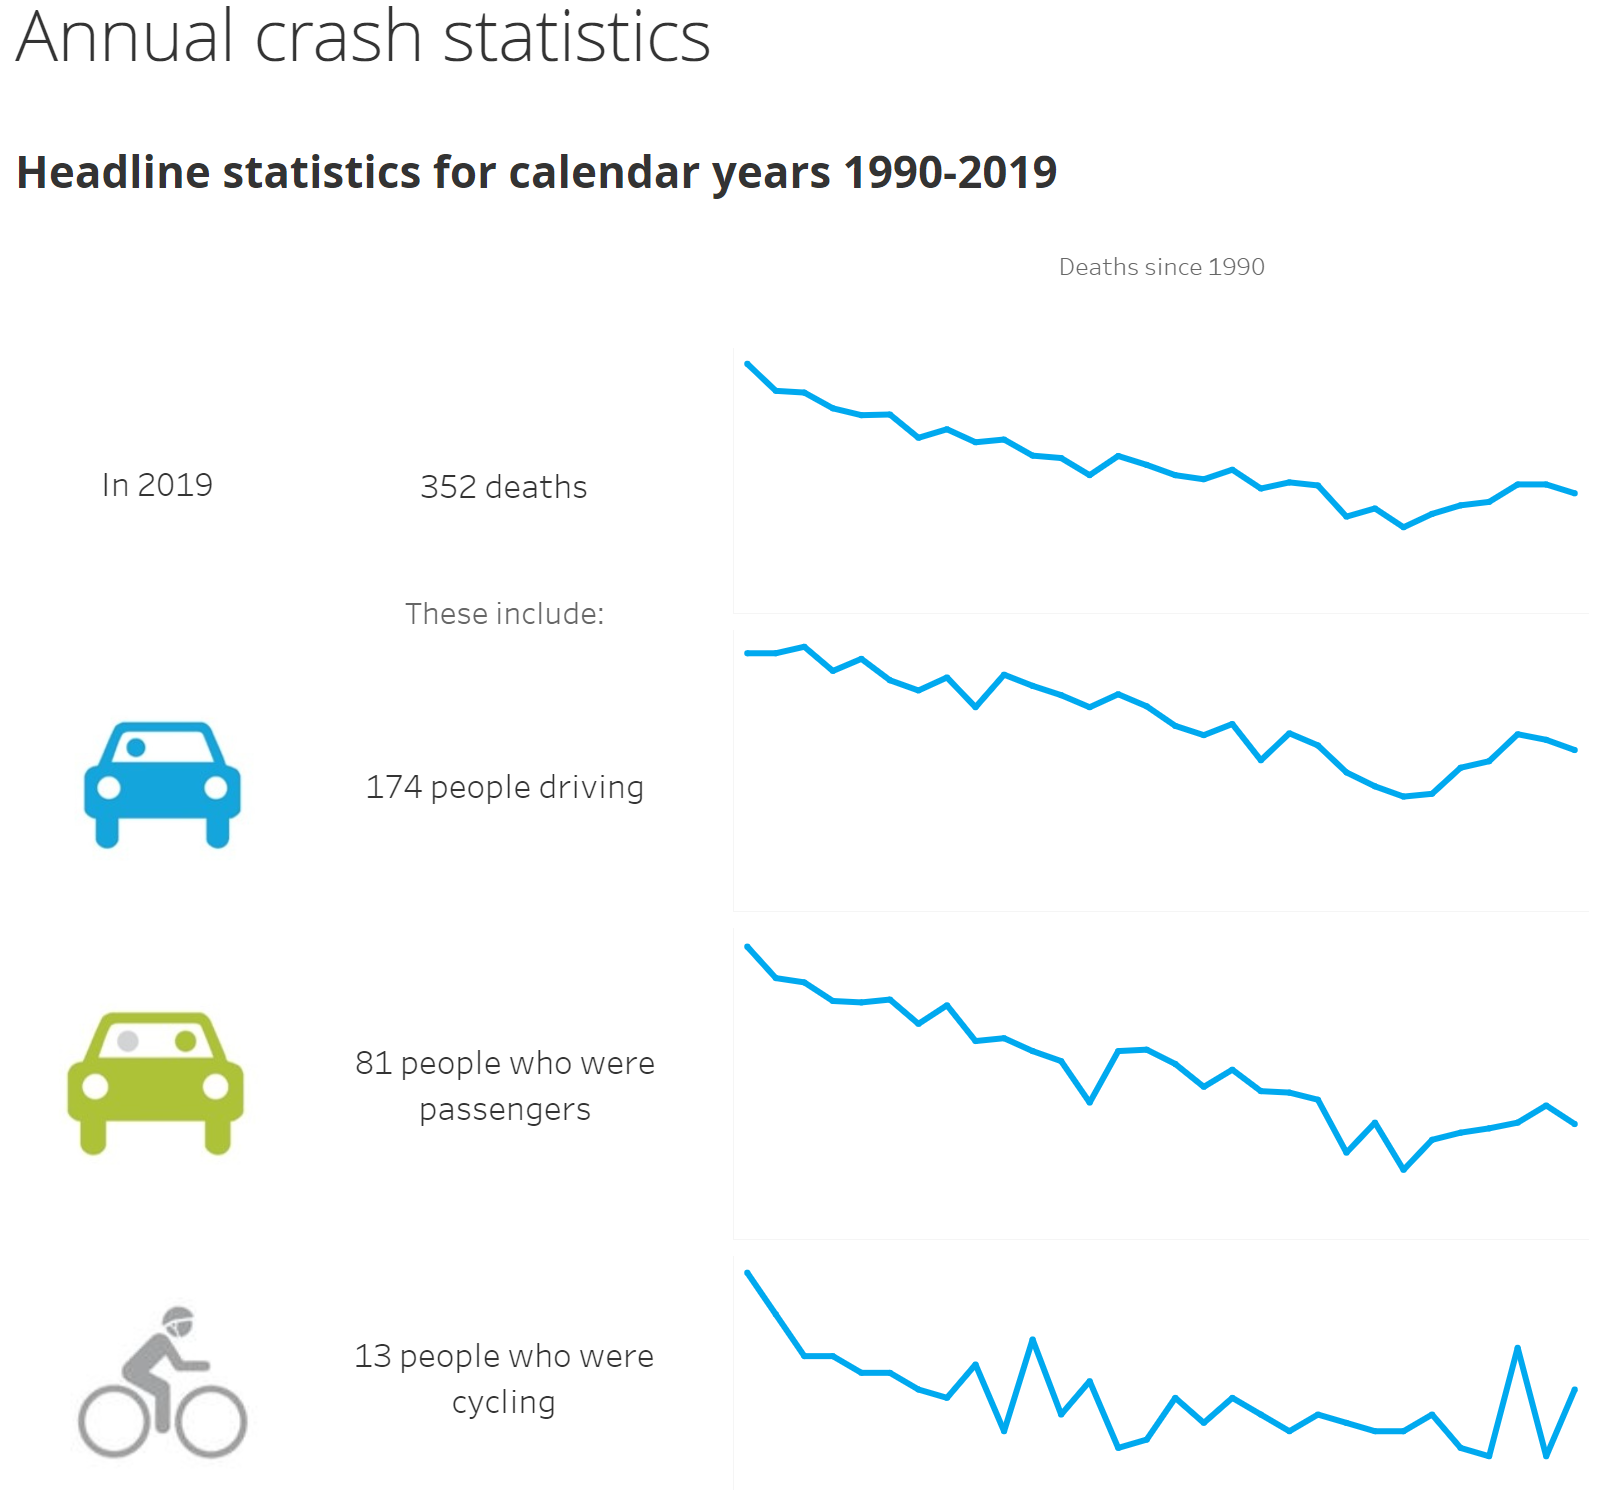
Ministry of Transport
Ministry of Transport has released Transport Dashboards using Tableau. The dashboards offer a variety of statistics, interactive graphics, and data download capabilities.
A variety of interactive reports and visualisations are accessible, including:
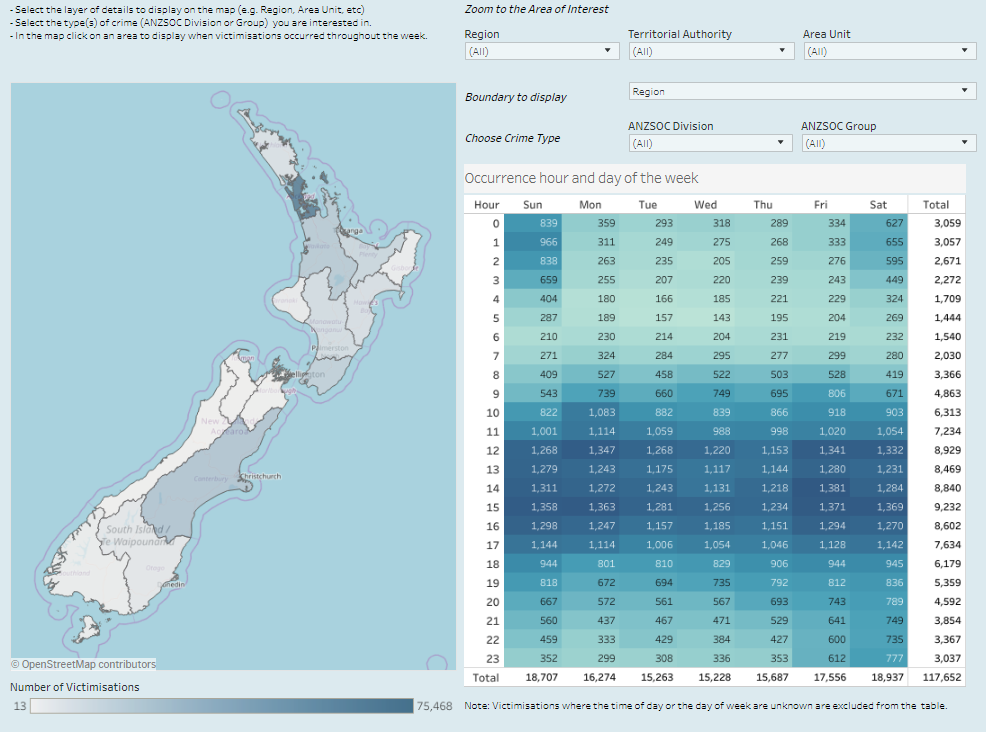
• Where and when crimes occurred across New Zealand
• Offender and victim demographics, and
• Activities (crime and non-crime related) that demand Police time
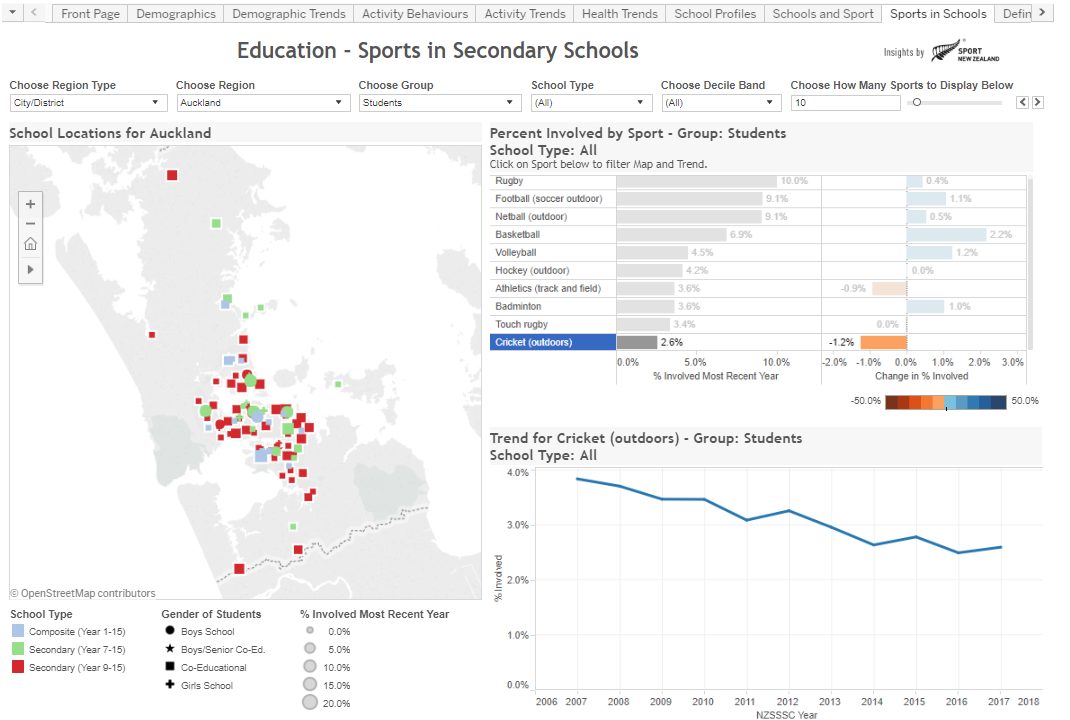
Sport New Zealand
Sport New Zealand’s interactive Insights Tool is designed to help those operating in the sport and recreation sector to better understand their participants and plan for future demand. Users will develop a better understanding of New Zealand’s changing population and the different ways people are participating in sport and recreation.
The Insights Tool combines sport, recreation, health, population and schools data. Both the public and the sector can better understand what’s happening at a local level throughout the country.
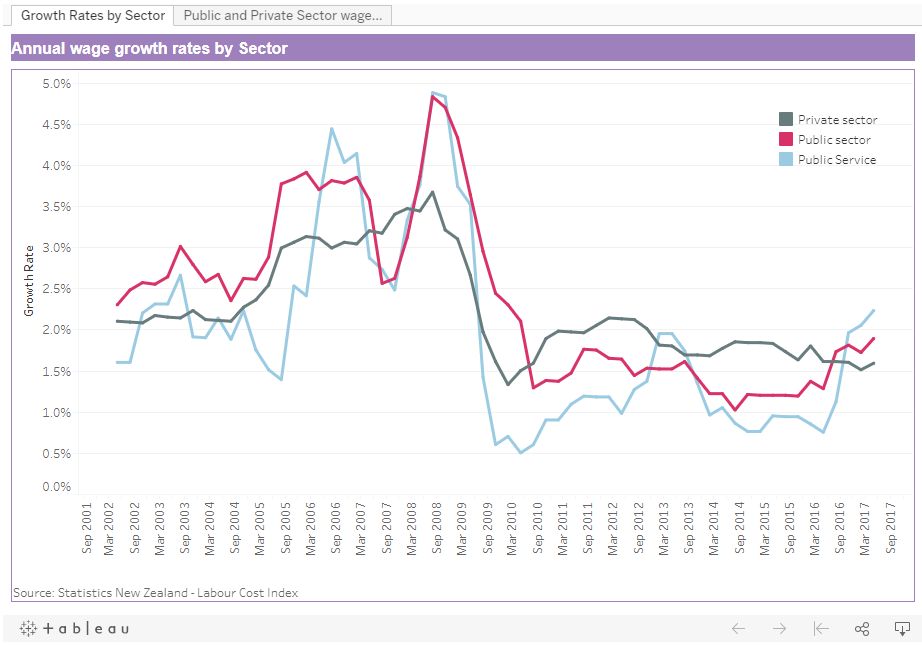
Public Service Commission (PSC)
The Public Service Commission publicly releases analysis on the State sector workforce so New Zealanders have more visibility about who works in our public agencies, what their roles are, how much people earn and where it is they go to work.
The analysis shows trends over time, at an individual agency level and aggregated up to Public Service level, and assists agencies in making informed decisions about their workforce, to improve the delivery public services.
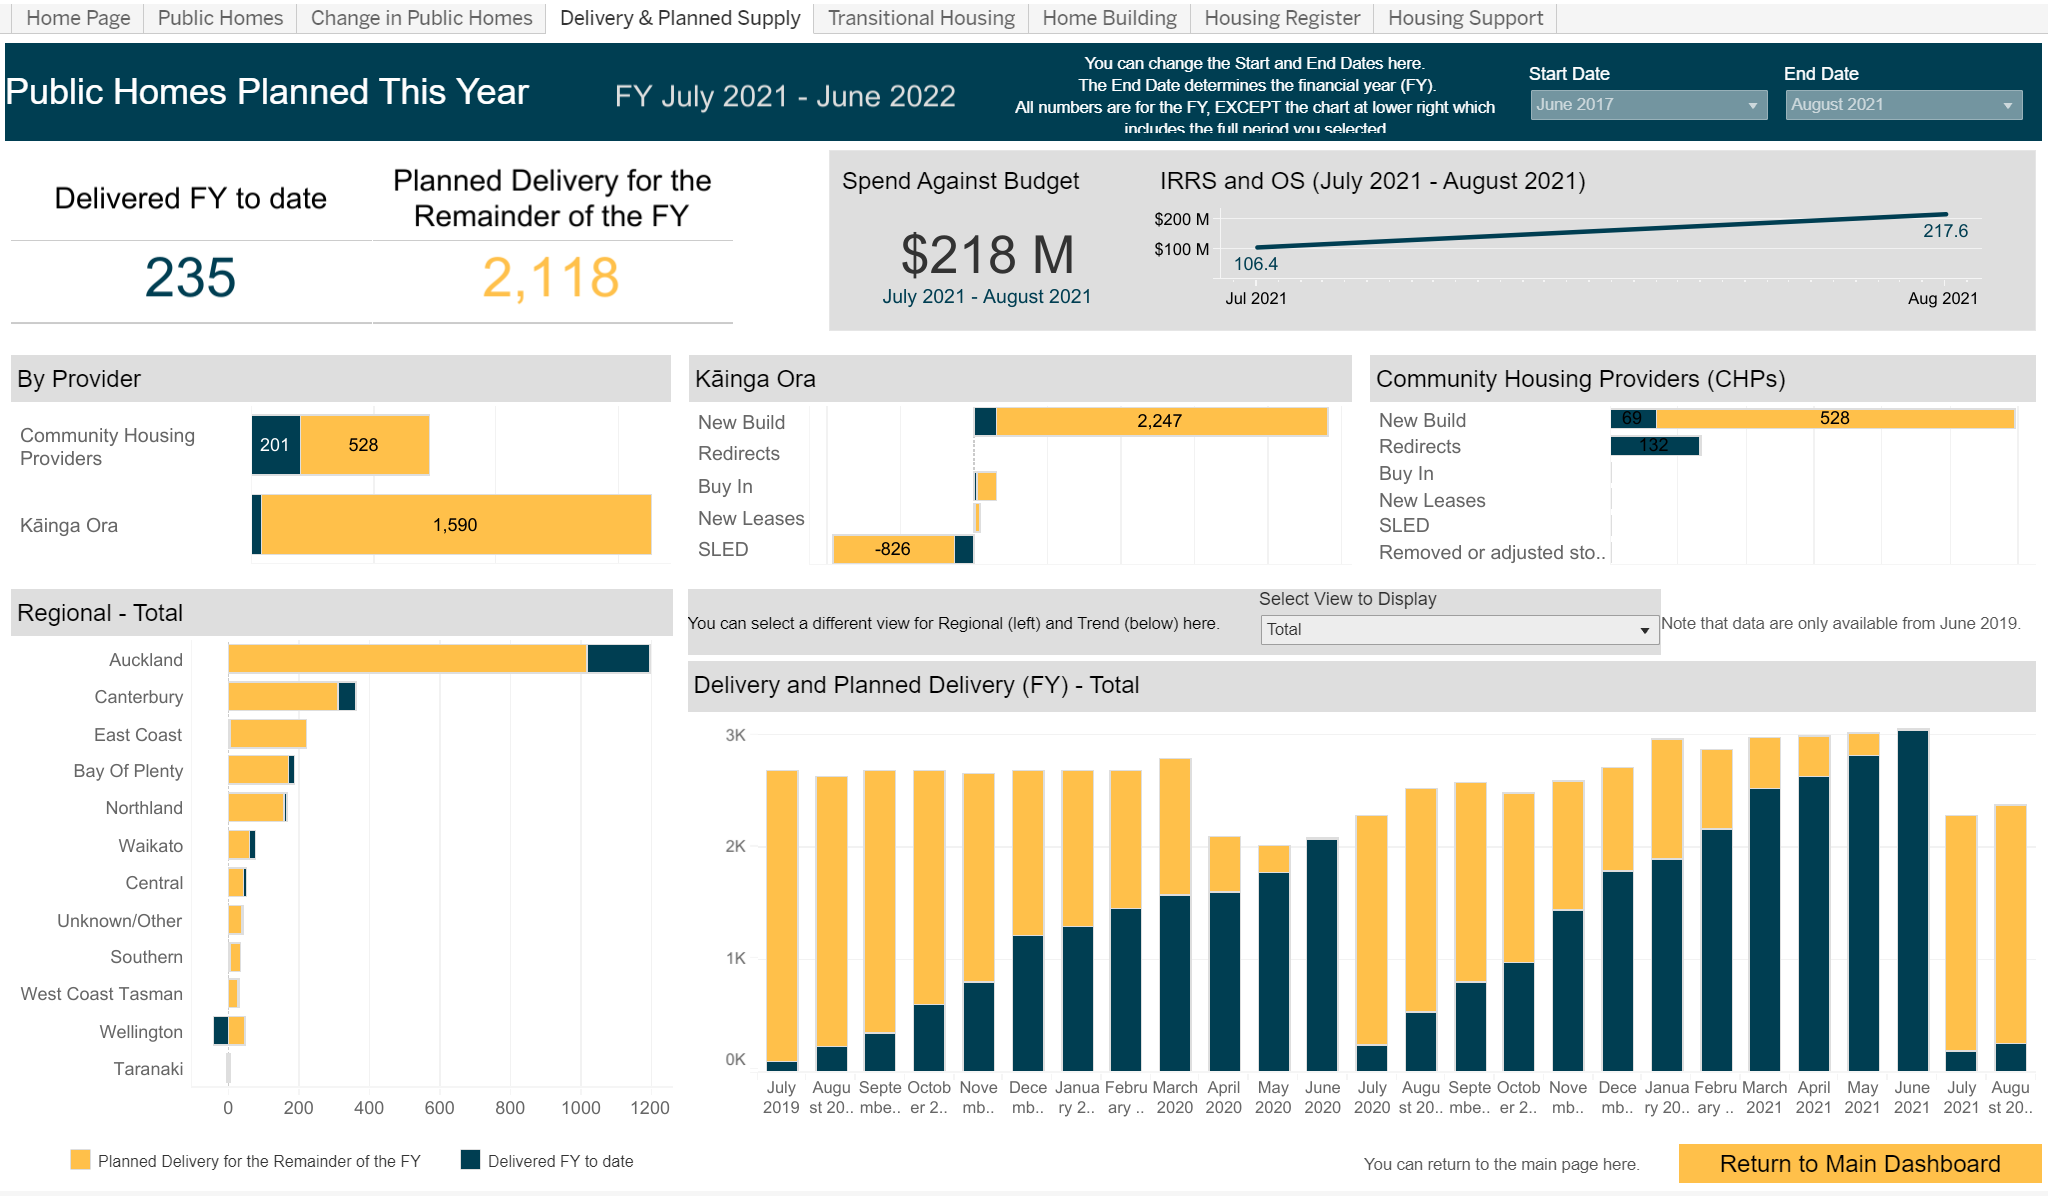
Te Tūāpapa Kura Kāinga – Ministry of Housing and Urban Development (HUD) leads New Zealand’s housing and urban development work programme. HUD are responsible for strategy, policy, funding, monitoring and regulation of New Zealand’s housing and urban development system.
The Housing Dashboard is a single place to track progress of key parts of the Government’s housing programme.